 Travel and Hospitality


SproutLoud Reports and Dashboards Help Accomplish Critical Jobs to be Done
Welcome back to SproutLoud’s Distributed Marketing Jobs to Be Done newsletter, where we explore how you can use SproutLoud software to accomplish the jobs that need to be done to deliver exceptional local marketing results. Across all of our interactions with our customers, we’ve identified seven key Jobs to be Done that we believe SproutLoud can play a key role in helping to make easier and their related outcomes more successful. These seven are:
- Improving control of brand and messaging through distributed users
- Expediting speed of content to market
- Increasing awareness of adoption of content among users
- Providing expected experiences to digital consumers
- Optimizing the impact of content/spend
- Obtaining clear and timely reporting on users
- Providing exceptional user satisfaction
In this issue of our newsletter, we explore how SproutLoud reports and dashboards are valuable tools that can help you accomplish three Jobs to be Done that are critical to success:
- Increasing awareness of adoption of content
- Optimizing the impact of content/spend
- Providing exceptional user satisfaction
Increase Awareness of Adoption of Content
National or regional channel marketing and sales teams spend a lot of time producing materials for their local user partners to utilize when engaging with end customers. The understandable thinking is that these materials will help to compel end customers because they are on-brand and provide a consistent engagement experience. However, these materials are only useful if they are used. SproutLoud makes it easy for national and regional teams to understand exactly what content is being utilized at the local level.
For example, our Template History Usage Report provides template usage data. Specifically, when a user accesses this report, they can determine template ID, template name, the date template was created, status, year, and most importantly, monthly and annual usage counts. This data can also be easily filtered. This report will allow you to determine if the content you worked hard to produce is actually being used. If you see high usage, then you know that you’ve struck a chord, and this could be an area worth more investment. If you’re not seeing usage, it may be a good reason to speak with local users to understand why there is light usage. Are the materials not for a tactic type frequently used? Is the message somehow off from the perspective of local users? All in all, you will start down a path toward strong content usage insights that will then lead to maximized adoption in the future.
Another report that will help you to determine content adoption is our Download Center Network Usage Report. As a reminder, the Download Center is a capability within the SproutLoud platform that allows national and regional brand users to organize and manage all non-customizable assets for direct download by local users, including the ability to mark assets shareable, tag assets for easy search, permission assets to respective Account Groups, and manage copyright dates. The Download Center Network Usage Report lists all download center assets and the total download counts for each asset across the entire network. This is a terrific way to track usage of the materials.
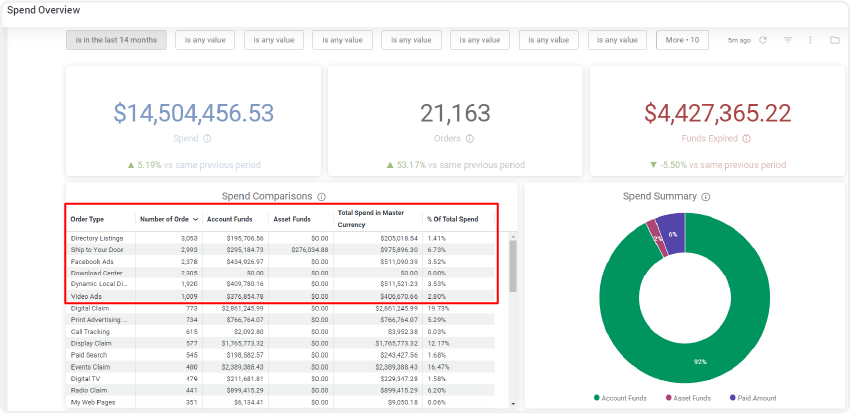
Lastly, users can leverage the Spend Overview Dashboard to determine which tactics and content types are most used or unused by your network. The Spend Overview Dashboard offers this visibility when the date range is selected to analyze both popular tactics and tactics with low usage.
One popular and recommended way to use this report is to look at the number of orders for a given tactic. This view helps users find the most popular tactics used by their network and the funds applied to them. Knowing the preferred tactics, the brands can decide to create more specific content for those tactics given their popularity, adjust funds rules over them, or decide a strategy to engage more partners focusing on those popular tactics. This visualization also offers the ability to see the data broken by different dimensions, allowing users to filter only the specific Order Types or Partner ID to identify the top tactics and content by partner.
Optimize Impact of Content/Spend
A second way that SproutLoud reports and dashboards can help you deliver on your Jobs to be Done is by going beyond content usage to help determine the impact content has on sales at the local level. Afterall, no matter what content is used or not used, it’s ultimately the impact that content has in-market that is most important to your network’s ultimate success.
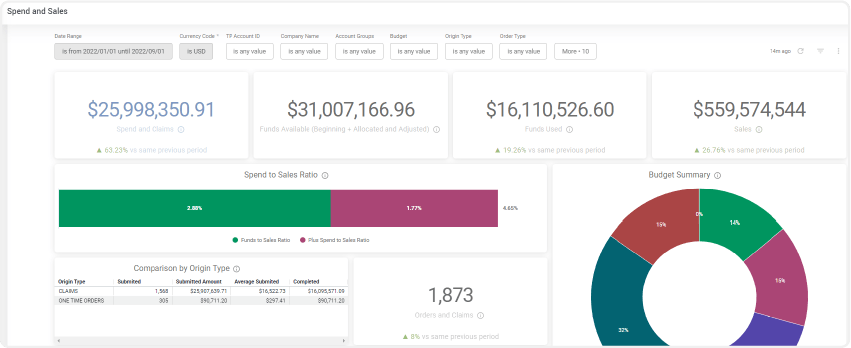
Brands usually do this type of analysis themselves, using their resources to combine data from different sources and formats to get the information they need. SproutLoud offers our Spend and Sales Dashboard, which incorporates sales data from brands with marketing campaign spending and analyzes this through our platform. By taking advantage of our sales and marketing analytics capabilities, brands receive the support they need for decision-making, and they get data consistency and process standardization for the spend versus sales analysis.
Elements that make this possible include:
- Ingestion of sales data
- A systematic process to combine external and internal data
- Data modeling and visualization for brands and partners
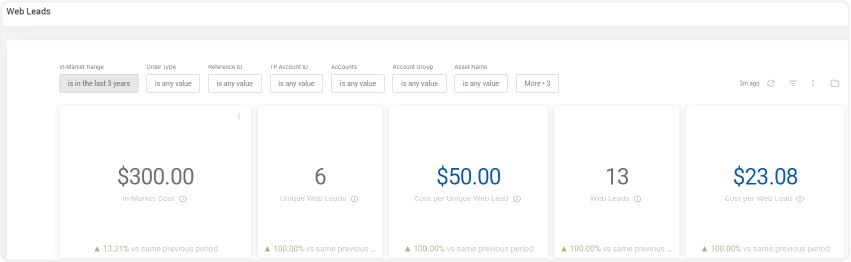
Furthermore, in cases where a brand has campaigns to collect web leads, we can show the analysis of the campaigns used to collect those leads using the Web Leads Dashboard. This dashboard helps brands and partners understand the effectiveness of their campaigns and the cost per lead acquired. This information helps brands decide if a specific campaign or content is performing as expected and make decisions on changes over market dates, cancellations, and the creation of new content.

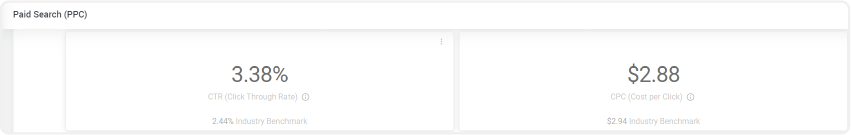
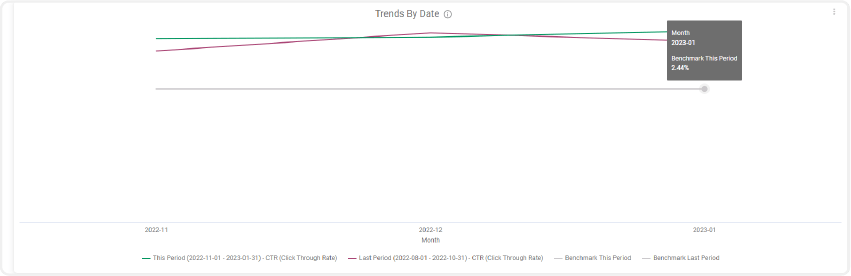
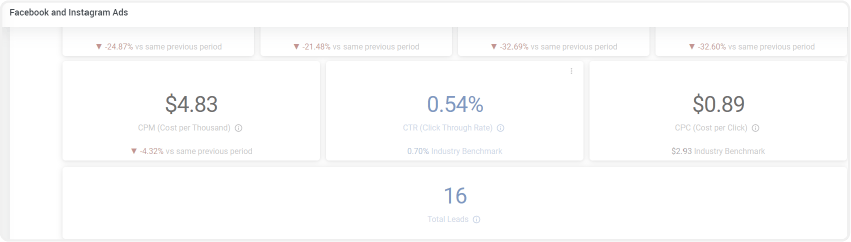
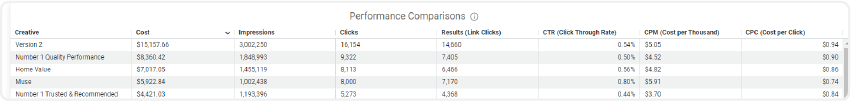
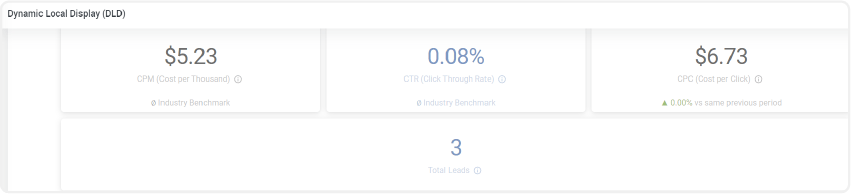
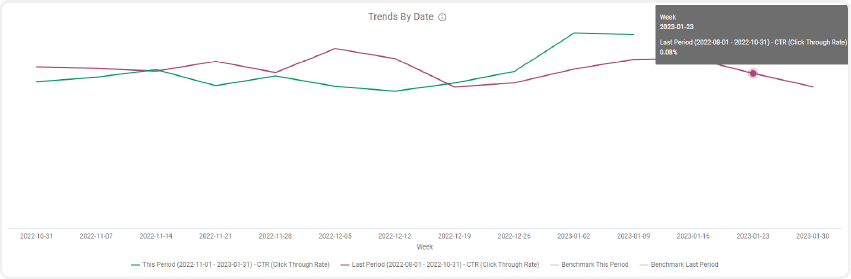
If a brand has digital tactics such as Paid Search, Facebook or Instagram Ads, or Dynamic Local Display in their marketing plans, they can access SproutLoud dashboards for each of these tactics to better understand content performance at different levels and to compare with industry or custom benchmarks. This helps identify which content and campaigns are exceeding, meeting, or missing expectations.
Provide Exceptional User Satisfaction
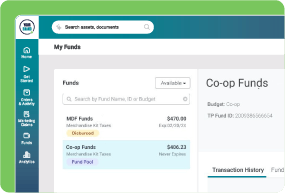
In the end, we all want our users, especially our local users, to find SproutLoud to be a strategic tool that helps them reach their ultimate goals of driving more leads and sales. A key aspect of making all of this work, and thereby satisfying local users, is the flow of money associated with running local marketing. Local users want to know exactly how much they have in funding and be able to easily activate these funds, while national and regional channel marketers and sellers want to know if funds are being utilized. In addition, local users want to be able to process claims for activity executed outside of a system like SproutLoud, and they want all of this to be done quickly. SproutLoud has several reports that can help brand users gain insight regarding funds usage and claims processing:
- Funds Balance Report: This report gives the brand the available amount per fund per partner and its status, including the money left per fund or budget for future campaigns. This report is focused on depicting current fund balances.
- Fund Summary Report: This report shows funds metrics for a specific date range, including: Funds Available at the beginning and end of the selected date range, as well as funds that are Used, Reserved, Credited, and Expired within a given time frame.
- Completed Claims Report: This report details information on closed or denied claims. Brands can easily see information regarding when claims were submitted, closed or denied, and reasons for denial. All this can be done in aggregate or by local users.
- Active Claims Report: This report outputs active claims. Pre-filters include claim statuses (Submitted, Need More Info, Approved, Processing Payment) and marketing activity. You can also pull unprocessed amounts, which indicate approved, remaining amounts yet to be processed due to insufficient funds.
- Claims Transaction Report: This report gives the brand details about each step in the claims process, from submission to close, so users can track the progress of claims submitted by their local users, down to the most granular level.
So, hopefully we’ve provided some interesting ways to use SproutLoud reports and dashboards to help complete some of the critical Jobs to be Done, that we’ve identified in working with our clients. We believe that fully using these reports and other analytic information within the SproutLoud platform will better serve to ensure the success of your content and the satisfaction of your local users.
Ready to see what SproutLoud can do for you?